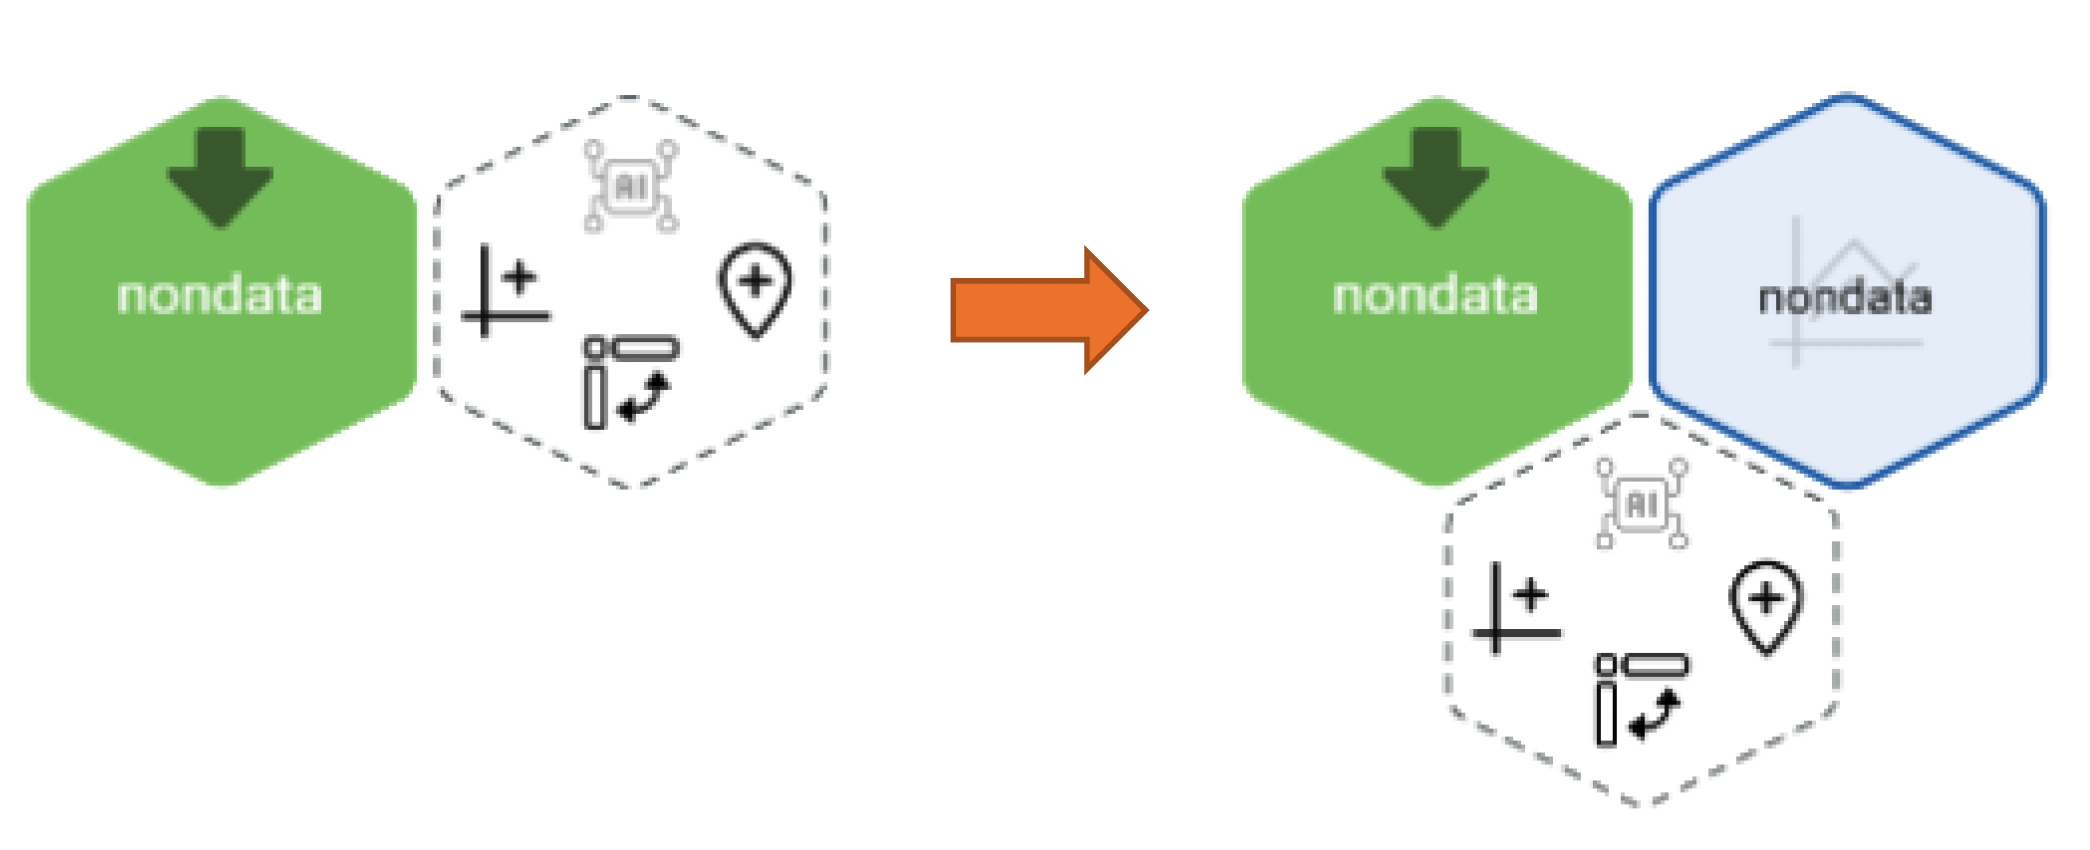
Select the chart icon to the right of the yellow-green hexagon that was just created.
Choose a line chart (white version) among the chart types and click the Next step.
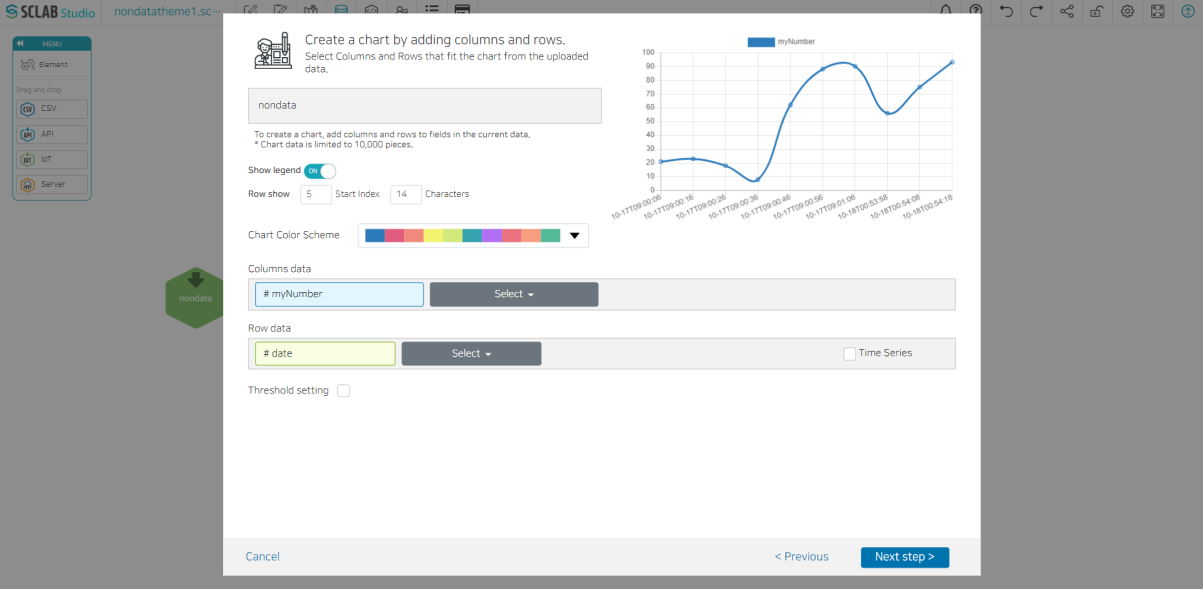
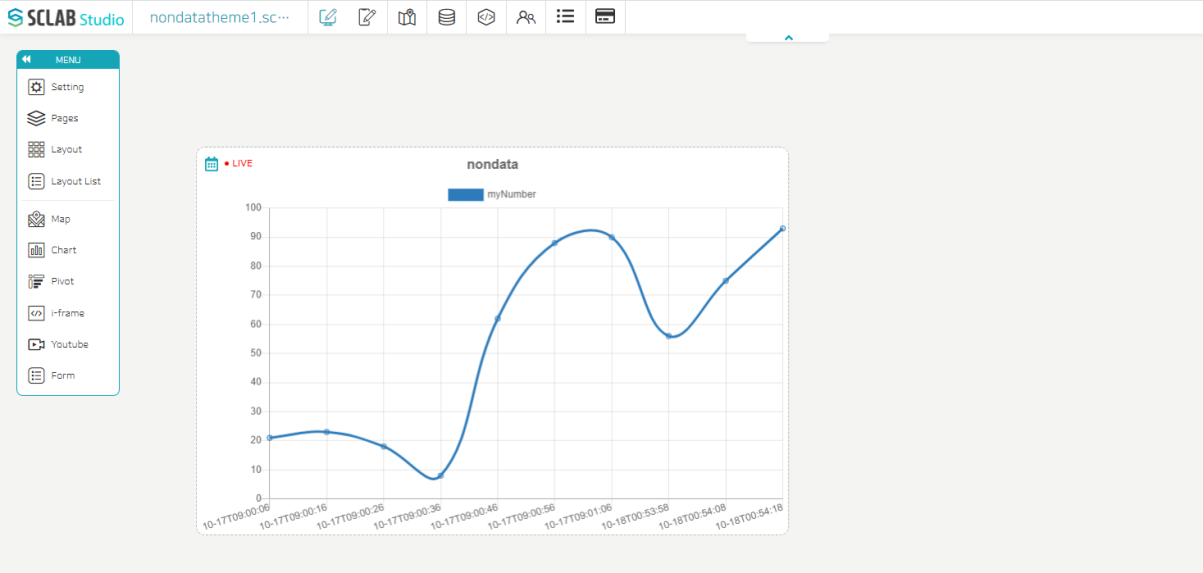
IoT charts are available in real time. If you check the Time Series, when you drop the chart in the layout, you can search by time/date interval with LIVE display as shown below.
Set the data to set the threshold and the threshold name, value, and color.
Click Next Step, check the chart, and then click the Save button.
You can see that one more chart icon has been created to the right of the yellow-green IoT hexagon icon.